
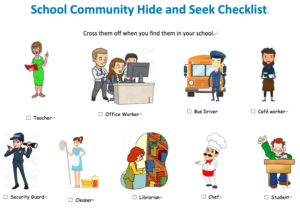
Link this exciting activity to activate learning on a sensory level when exploring the School Community Helpers theme. Students explore school and find out who they are. Click image you can find out “School Community Hide and Seek Checklist“.
□ Teacher
□ Office Worker
□ Bus Driver
□ Café worker
□ Security Guard
□ Cleaner
□ Librarian
□ Chef
□ Student
are already in.
If you want to edit it, I prepare for you editable version. You can edit it as you like.
[Editable] School Community Hide and Seek Checklist
Product Description
Link this exciting activity to activate learning on a sensory level when exploring the School Community Helpers theme. Students explore school and find out who they are.
□ Teacher
□ Office Worker
□ Bus Driver
□ Café worker
□ Security Guard
□ Cleaner
□ Librarian
□ Chef
□ Student
□ Nurse
are already in.
You can edit yourself as you like.
It contains these 3pages
1. Check List
2. Counting by Tally Marks
3. Graph
Check out free PDF virsion is here
1. Check List
https://www.teacherspayteachers.com/Product/School-Community-Hide-and-Seek-Checklist-4924947
2. Counting by Tally Marks
3. Graph
School community hide and seek Data handling
Kindergarten Graphing & Data Worksheets and Printables
Graphing data is a skill required for basic math, and believe it or not, it’s something your child can achieve in kindergarten. This graphing and data worksheets let young learners explore mathematics.
This worksheet will help the children can practice counting tally marks and make graph in practically. Students explore their school community and count school community members. They can do collecting data and represent data in graph through community unit.
Tally Marks Practice
Counting skills and data keeping
Data handling
Collecting data
It will help authentic opportunities for students to make spontaneous connections between the learning that is going on in mathematics and other areas (in this case Social studies) of the curriculum and daily life.
Students can create living graphs using real objects and people.
Living graphs refer to data that is organized by physically moving and arranging students or actual materials in such a way as to show and compare quantities.
Students will develop an understanding of how the collection and organization of information helps to make sense of the world. They will sort, describe and label objects by attributes and represent information in graphs including pictographs and tally marks.