サイエンス Lab Report の書き方ガイド
Writing Science Lab Report
先生や分野によってConclusionsをDiscussionという場合があります。学校の先生に合わせて対応してください。
Scientific Method
- Identify the Problem
- Conduct Research
- Create a Hypothesis
- Perform an Experiment
- Analyze the Data
- Develop a Conclusion
Science Lab Report
1. Identify the Problem
Title: タイトル
実験レポート全体を短めに1文で表す。
Summarize this whole report, 6-8 words are fine.
例
An Investigation of changing in mass when magnesium burns
Investigation into how wire length affects current through a circuit
Investigation ice melting in the water
Aim, Purpose: 目的
実験の目的、何を観察するか
例
目的なのでto+動詞で書くと〜のため(目的)という意味になります
To investigate the weight of magnesium before and after burning.
To determine the length of the wire affects the current of the wire.
=Research Question
リサーチの質問:目的を疑問文の形に書き換える
How does changing the weight of magnesium before and after burning?
How does changing the length of the wire affect the current of the wire?
2. Conduct Research
リサーチのトピックに関する背景情報を収集します。
トピックと問題について他の人がすでに知っていることを調べる。次の仮説を立てる時のサポートエビデンスになるので信頼性のあるネット、サイエンスマガジン、学校の図書館から探します。引用元情報や参考文献を忘れないようにどこかにメモしておいてください。参考文献はレポートの最後にリストアップします。参考文献の表記方法は学校、先生の決めたスタイルに従ってください。
Keywords: APA, citation, experiment, hypothesis, MLA, problem, reference, reliability, research, resource, scientific background, supporting evidence
| English |
Japanese |
|
APA
|
引用スタイル
|
|
citation
|
引用
|
|
experiment
|
実験
|
|
hypothesis
|
仮説
|
|
MLA
|
引用スタイル
|
|
problem
|
問題
|
|
reference
|
参照、参考文献
|
|
reliability
|
信頼性
|
|
research
|
研究、リサーチ
|
|
resource
|
リソース
|
|
scientific background
|
科学的背景
|
|
supporting evidence
|
裏付けとなる証拠、エビデンス
|
3. Create a Hypothesis
Hypothesis: 仮説
仮説を立てる:科学的背景に基づいた実験の自分の予想
=guess what you think will happen in this experiment based on either research or previous experience
2で収集した情報がエビデンスになる
書き方: If … then … because…
例
If the length of the wire increases, then the current will increase, because the resistance will decrease.
If the length of the wire increases, then the current will increase, because the resistance will decrease.
If dry bread and moist bread are left in bags for two weeks, then the moist bread will grow mold more quickly than the dry bread, because mold is a living organism, and organisms need water to survive.
If magnesium ribbons are burned in the air, then the magnesium ribbons will increase their weigh, because magnesium will react with oxygen in the air.
If the water is higher temperature, then the ice cubes in the water melt faster because molecules in warm water move faster than molecules in cold water.
Keywords: decrease, evidence data, hypothesis, increases, scientific background, If … then … because…,
4. Perform an Experiment
仮説をテストし、データを収集
Test your hypothesis and collect the data.
Safety and Ethics
安全と倫理: 実験を安全に行うルール
例
Safety hazards:
Beware of hot flames.
Wear gloves. When using the hydrogen peroxide (H2O2) and the hydrochloric acid (HCl) as they can cause chemical burns and skin irritation.
Wash hands with soap and water after 3. experiments or handling animals.
Tie back your hair.
Treat living things humanely.
Materials / Equipment
実験材料・器具:正確に単位、必要量もできるだけ記載。
Try not to say “Can you pass me the cup?” in lab.
| Good |
Bad |
1cm Magnesium Ribbon
5x medium test tubes
1x Plastic test tube rack
10g of salt
30cm ruler, ±0.05cm
250ml of water
500ml beaker
|
Salt
Cup
Water
Beaker
|
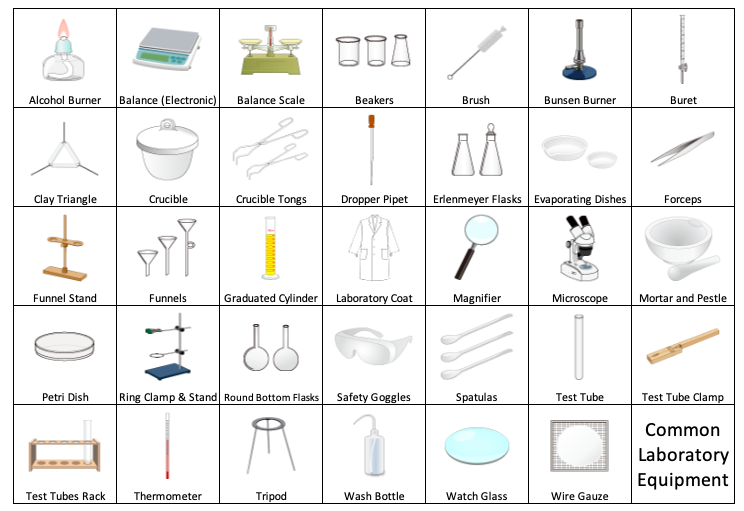
実験で使う用具を英語で言えるかな? ESL Common Laboratory Equipment vocabulary word mat, Science
Method
= Procedure, Plan
手順:他の人も自分と同じ実験操作ができるようにわかりやすく書く
動詞の現在形を使う。実験材料・器具が主体になるので、I,you,weは使わない
手順のステップを番号付きリストで書く
例
- Setup the circuit as shown in figure 1
- Using a ruler and scissors, measure and cut 10cm of the wire.
- Clip the crocodile clips onto the wire at 10cm apart.
- Switch on the circuit
- Record the current reading from the ammeter.
- Switch off the circuit.
- Repeat steps 2-6 but increase the length by 10cm to 20, 30, 40, and 50cm.
- Repeat steps 2 to 7 minimum of three times to calculate an average.
その他使えそうな動詞
Measure and cut 2cm of Magnesium using a ruler and scissors.
Hold the magnesium at the top of the blue flame of the Bunsen burner until it ignites.
Weigh the final mass and record any observations.
Label the testtubes 1-4.
1/4 fill tube 1 with deionised water and add a nail.
Pour liquid wax into aluminiun foil and record the mass(g)
Place a 50ml beaker on the scale and zero the scale
Observe the colour change during the reaction
Figure / Diagram: 図
タイトルをつける
Figure 1, Figure 2, のようにそれぞれの図に番号をつける
細い線で描くので鉛筆はきちんと削ったものを使用する
線を重ねたり、影、色をつけない、シンプルに描く
定規を使ってラベルの線をひく、矢印ではない
ラベルの線は交差しない
例
Figure 1: A diagram of how to set up the equipment to measure current of different lengths of a copper wire.
Fig.2: Top View of …

Results
実験を行う前に実験結果を記入するテーブルを用意する
Table for Quantitative data (Raw data)
- Independent variables (IV) と Dependent variables (DV)を特定する。
- 表データのタイトルをつける
- 表データの一番左縦列にIVの項目名と単位を()内に記入。
- 表データの一番上横列にDVの項目名と単位を()内に記入。
Title: —-
| Independent variable (unit) |
Dependent variable (unit) |
| Trial 1 |
Trial 2 |
Trial 3 |
| |
|
|
|
| |
|
|
|
| |
|
|
|
例
実験前
Title: The Effect of Length of wire on Current through a Circuit
| Length of the wire (cm) |
Current (A) |
| Trial 1 |
Trial 2 |
Trial 3 |
| 10cm |
|
|
|
| 20cm |
|
|
|
| 30cm |
|
|
|
実験中に以下のように表を埋める
Title: The Effect of Length of wire on Current through a Circuit
| Length of the wire (cm) |
Current (A) |
| Trial 1 |
Trial 2 |
Trial 3 |
| 10cm |
5.2A |
5.3A |
5.1A |
| 20cm |
4.3A |
4.2A |
4.6A |
| 30cm |
3.7A |
3.5A |
3.5A |
実験中の観察データはQualitative Dataとして文章で記録する。
Keywords: column, controlled variables, dependent variables (DV), independent variables (IV), observation, qualitative data, quantitative data, raw data, row, table data, trial, unit
| English |
Japanese |
|
table data
|
表データ
|
|
header columns
|
一番左縦列
|
|
header rows
|
一番上横列
|
|
unit
|
単位
|
|
trial
|
トライアル
|
|
variables
|
変数
|
Controlled variables = Control
実験中、一定に保つ変数。よく計画された実験ではIV以外の変数はすべてコントロールされる必要があります。
例:高さのある斜面を車が降りるのにかかる時間の実験では次のことがコントロールされます:同じ斜面、同じ台車、同じタイマー、同じ時間を測る人、台車を離す操作
Dependent variable = Responding variable
実験の結果データ、実験によって出た値
例:植物の成長と日照時間についての実験をした時の植物の高さ
Independent variable = Manipulated variable
実験する人が操作する値
例:植物の成長と日照時間についての実験をした時の日照時間
Quantitative data
体積、長さ、温度など、実際に実験で得られた数字のデータ。
例
Mass Before: 0.31g
Mass After: 0.37g
Qualitative data
五感で感じる観察データ。
見る、聞く、かぐ、味わう、さわることで得られる感覚的なデータ。化学薬品を扱うので味わうはあまりないかもしれません。文章で記録し、数字を含むデータはここでは触れません。
結果なので過去形で書く
Observation: 観察
例
Smelled nothing
The colour of substance changed from metal to green.
The wire became very hot.
The Balloon was shrinking itself when I put into the box A.
It came out bubbles in the beaker.
Smelled similar to rotten eggs.
Raw data
実験の結果データが偶然出た結果ではなく統一性のあることがわかるように、最低3回トライアル実験をして、その時の実験結果データ全部を事前に用意した表に記録します。写真やビデオでも記録することがあります。
5. Analyze the Data
Data Analysis: 実験データを整理、調査、グラフ化
Processed Data
実験が終わったらRaw Dataで得られた実験結果の平均値、中央値、最頻値など、計算して得られるデータに加工します。得られたデータはグラフにしたりして、データをわかりやすくします。計算式、公式はSample Calculationsに書く。学習進度、学年によってはAverageではなく統計の正式名称のMeanを使用するように言われるかも。
Keywords: average, calculation, examine, formula, graph, mean, median, mode, organize, processed data
| English |
Japanese |
|
average
|
平均
|
|
mean
|
平均値
|
|
median
|
中央値
|
|
mode
|
最頻値
|
|
calculation
|
計算
|
|
formula
|
公式
|
|
graph
|
グラフ
|
|
analyze(AE)/analyse(BE)
|
分析する
|
|
organize(AE)/organise(BE)
|
整理する
|
|
processed data
|
加工したデータ(反対語 raw data:生データ)
|
Sample Calculations
例
Calculation of Average time taken: (Trial 1 + Trial 2 + Trial 3) / Number of trials
Calculation of Average: (10+ 12+ 11) / 3
加工後のQuantitative data tableはまた新しく作る(先生によっては、Raw data Tableの右端にAverageのカラムをつけて新しくテーブルを作らない場合もあるので、臨機応変に対応してください。)
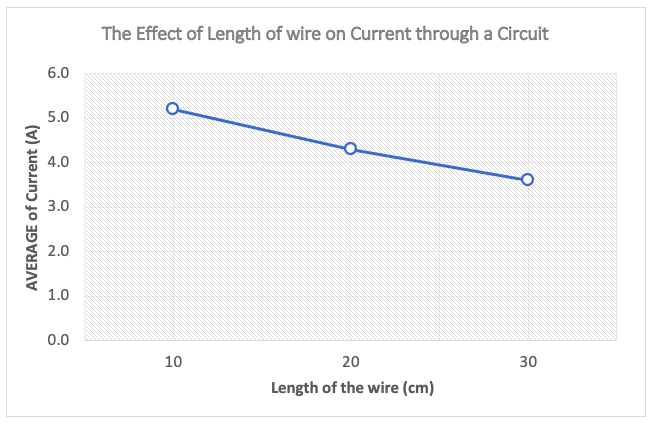
Title: The Effect of Length of wire on Current through a Circuit
| Length of the wire (cm) |
AVERAGE
of Current (A) |
| 10cm |
5.2A |
| 20cm |
4.3A |
| 30cm |
3.6A |
Graphing Data
加工したデータをグラフにして実験結果を見やすくする。
IVによって最適なグラフを選択する。
参考:
連続型データ:折れ線グラフ、散布図
離散型データ:棒グラフ、円グラフ
Independent Variable (IV)はx軸
Dependent Variable (DV)はy軸
両方の軸にラベルと単位を忘れない
グラフタイトルを忘れない
適切な数値目盛り
必要に応じて凡例
複数のグラフがある場合は番号をつける
例
Keywords: axis, bar graph, continuous data, discreet data, label, legend, line graph, pie chart, scatter plot, the horizontal axis, the vertical axis, unit
| English |
Japanese |
|
line graph
|
折れ線グラフ
|
|
bar graph
|
棒グラフ
|
|
pie chart
|
円グラフ
|
|
scatter plot
|
散布図
|
|
continuous data
|
連続型データ
|
|
discreet data
|
離散型データ、とびとびの値
|
|
axis
|
軸
|
|
unit
|
単位
|
|
the horizontal axis
|
横軸、x軸
|
|
the vertical axis
|
たて軸、y軸
|
|
label
|
ラベル
|
|
legend
|
凡例
|
Interpretations of data
データの解釈
どんなデータを収集できたか?
IV:
DV:
単位忘れない
データのパターンを見つける
The dependent variable is increasing.
The dependent variable is decreasing.
The dependent variable does not change.
Quantitative data
読む人がグラフを見なくても分かるように説明
例
The horizontal axis is IV temperature of the water in degrees.
The vertical axis is DV time of melting ice cubes in minutes.
As independent variable increases, dependent variable increases.
As independent variable increases, dependent variable decreases.
As independent variable decreases, dependent variable decreases.
There is a linear relationship between the two variables.
There is an exponential relationship between two variables.
Qualitative data
実験の進行に伴って観察された傾向とパターンを説明
その他
▪ Equations (relationships) etc.
▪ Any anomalous data?
▪ Was all data used in the calculations?
6. Develop a Conclusion
仮説を検証(Conclusion)し、実験を評価(Evaluation)
Conclusion = Answer Reserch Question
Evaluating the Hypothesis
- 仮説を検証
Restate Aim:実験目的を結果として過去形で言い換える
書き方:The aim of the experiment was to investigate the effect of the (IV) on the (DV).
例
The aim of the experiment was to investigate the effect of (IV) temperature of the water in degrees on the (DV) time of melting ice cubes in minutes.
-
データとグラフの結果を要約(データの解釈)
例
As (IV) temperature of the water increases, (DV) time of melting ice cubes decrease. There is a negative linear relationship between the two variables.
-
仮説が実験結果と一致したかどうか (supported or not supported)
書き方:The hypothesis that (insert your hypothesis) was (supported, partially supported, or not supported.)
例
The hypothesis that if the water is higher temperature, then the ice cubes in the water melt faster because molecules in warm water move faster than molecules in cold water was supported.
上記1-3をまとめると以下のようなConclusionになる
Conclusion
The aim of the experiment was to investigate the effect of (IV) temperature of the water in degrees on the (DV) time of melting ice cubes in minutes. As (IV) temperature of the water increases, (DV) time of melting ice cubes decrease. There is a negative linear relationship between the two variables. The hypothesis that if the water is higher temperature, then the ice cubes in the water melt faster because molecules in warm water move faster than molecules in cold water was supported.
Keywords: conclusion, evaluation, hypothesis, restate, results, summarize, supported
| English |
Japanese |
|
conclusion
|
結論
|
|
evaluation
|
評価
|
|
restate
|
言い換え
|
|
results
|
結果
|
|
summarise(AE)/summarize(BE)
|
要約
|
|
support
|
サポート
|
Evaluating the Method & Suggesting Improvements: 実験方法の評価と改善点
すべての実験にはデータに偏りや、正確で信頼性が低くなったりする要因があります。実験で発生する可能性のあるエラーの原因と、次回それらを改善する方法を特定します。Method(方法)の改善の例が少なくとも1つあるはずです。
Reliability 信頼性
実験結果の信頼性をどのように確保したかを特定する。
Consistency 一貫性
例
トライアルに使用する氷の重さの合計は同じだが、形状とサイズがそれぞれ異なる。
Each trials total amount of ice cubes is same weight but all different shapes and size.
Measuring tools 測定ツール
例
測定時間を時計なしで秒数を数える
Counting out loud to measure time without using watch.
Validity 有効性
有効性は、結果が有効かどうかを指します。変数を調べます。
適切な変数
例
実験時間が足りなくなり測定時間を適当に出した。
Because of the lack of time to experiment, some results of (DV) the measurement of time were produced by guess work.
適切なツール
測定ツールが変数を測定する適切な方法であることを確認
例
時間を測定するツールを時計からストップウォッチにする
Change from my watch to using stopwatches to measure time.
その他エラーの確認
▪ 参考文献
▪ データ加工
Suggesting Improvements
改善点は現実的で具体的であること。抽象的なtry harder, do more(がんばる)ではない。
Keywords: accurate, consistency, error, factor, reliability, validity, variables
| English |
Japanese |
|
accurate
|
正確
|
|
consistency
|
一貫性
|
|
error
|
エラー
|
|
factor
|
要因
|
|
reliability
|
信頼性
|
|
validity
|
有効性
|
|
variables
|
変数
|
Further Investigations
実験に関連した自分の考え
If you had more resources and time, what would you have done to improve and/or extend this practical?
例
If I had more resources and time, I would have prepared precise stopwatches to measure time.
What other investigations have the conclusions from this investigation inspired?
例
Next time I would like to investigate the relation between temperature of water and dissolving sugar quantity in it.